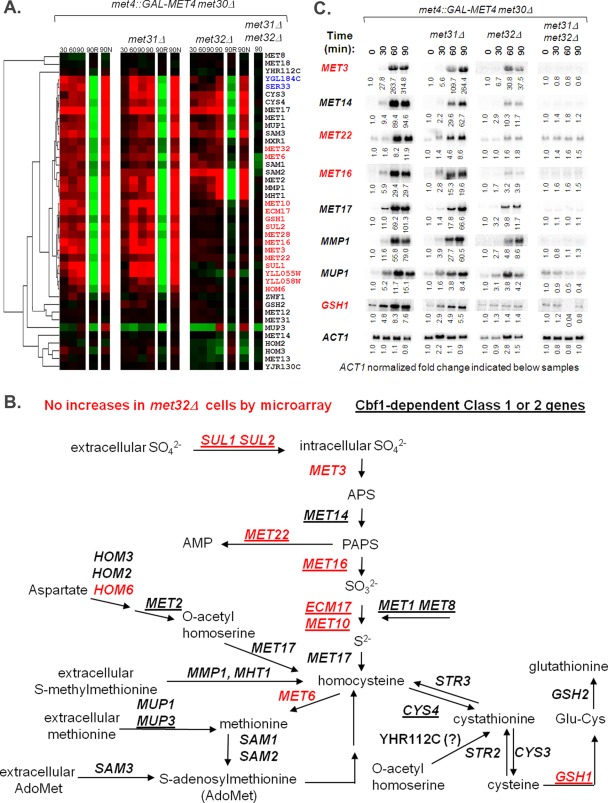
FIGURE 4:
Distinct sectors of the sulfur metabolic pathway are affected by Met32 loss. (A) Hierarchical clustering of microarray profiles on sulfur metabolism genes. Genes lacking visible microarray induction upon active Met4 in met32∆ cells are written in red, and genes showing weak or delayed microarray induction upon active Met4 expression in met32∆ cells compared with wild-type and met31∆ cells are written in blue. Genes that exhibit similar microarray profiles for wild-type, met31∆, and met32∆ cells are written in black. (B) Schematic of the sulfur assimilation pathway (adapted from Thomas and Surdin-Kerjan, 1997). Genes lacking visible microarray induction upon active Met4 in met32∆ cells are written in red. Cbf1- and Met28-dependent class 1 and class 2 genes are underlined. (C) Northern analysis of selected sulfur metabolism transcripts affected by Met32 loss.

