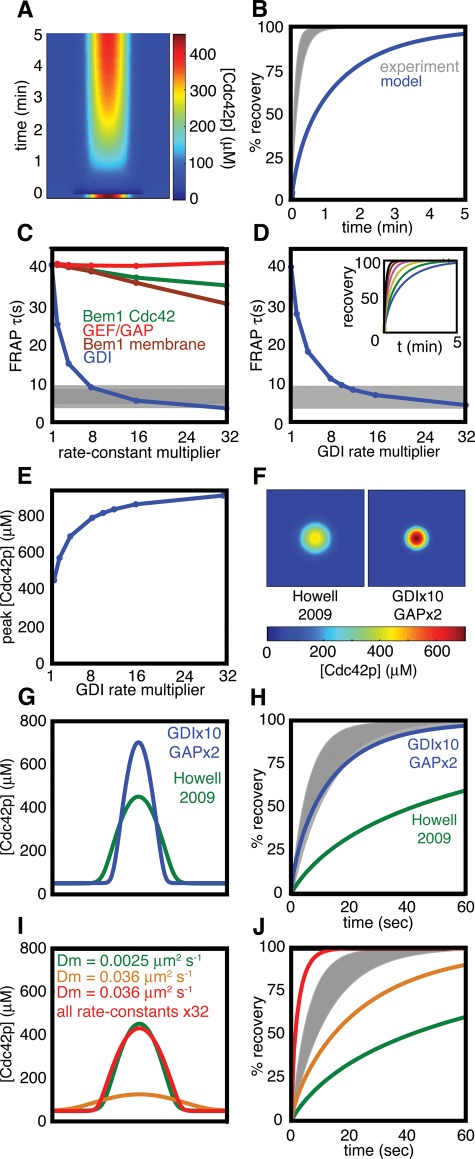
FIGURE 2:
Comparison of simulated and experimental FRAP in latrunculin-treated cells. (A) Kymograph of a simulated FRAP experiment. A slice through the center of the plasma membrane (x-axis) is plotted against time (y-axis). The starting condition is the steady state (Figure 1D), and the dark blue at time zero indicates where the Cdc42p in the polarized spot was “bleached.” Recovery of unbleached Cdc42p reveals the dynamic behavior of the model steady state. (B) Plot of the amount of unbleached Cdc42p in the polarization site from the simulation (blue) compared with experimental data from latrunculin-treated cells (gray zone = mean ± SD) from Slaughter et al. (2009). (C) Simulations of FRAP experiments varying model parameter sets (color as in Figure 1A, both forward and reverse rate constants multiplied by the same factor, simulated on a one-dimensional cell perimeter). τ, time to 50% simulated FRAP recovery; gray bar, mean ± SD for τ in latrunculin-treated cells (Slaughter et al., 2009). (D) Simulations varying GDI rate constants on a two-dimensional membrane. Inset, FRAP dynamics for increasing GDI rates plotted as in (B). (E) Effect of increasing GDI rate constants on the peak Cdc42p concentration. (F) Comparison of steady-state Cdc42p distribution using previous (Howell et al., 2009) vs. adjusted parameters. (G) The Cdc42p concentration profiles from (F) shown in cross-section. (H) Simulated FRAP kinetics using the new vs. old parameters, compared with the experimental FRAP. (I) Comparison of concentration profiles using diffusion constant 0.0025 μm2/s (green) or 0.036 μm2/s (gold). Adjusting all reaction rate constants to be 32× faster narrows the fast-diffusion peak (red). (J) Simulated FRAP kinetics for the peak profiles in (I).

