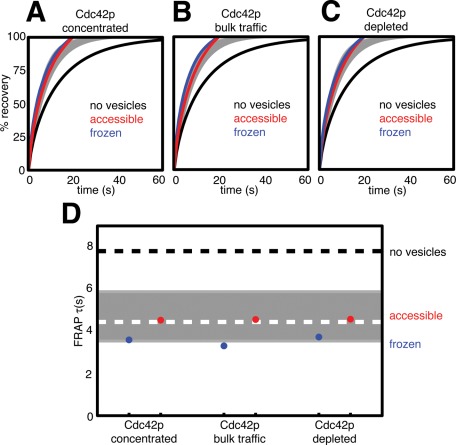
FIGURE 3:
Comparison of simulated and experimental FRAP in wild-type cells. Simulated FRAP experiments were conducted for each of the Cdc42p-trafficking scenarios. Blue and red lines show averaged data from 10 simulations each. Black line shows the simulated FRAP with no vesicle traffic from Figure 2H. Gray zone indicates range of experimental data. (A) FRAP assuming that Cdc42p is concentrated into both exocytic and endocytic vesicles. (B) FRAP assuming that Cdc42p undergoes bulk traffic. (C) FRAP assuming that Cdc42p is depleted from endocytic vesicles. (D) Time to 50% simulated FRAP recovery (τ) for all of the simulations. The gray bar indicates the mean (dashed white line) ± SD of experimentally determined τ values in wild-type cells (Slaughter et al., 2009). Black dashed line shows simulated FRAP τ with no vesicle traffic.

