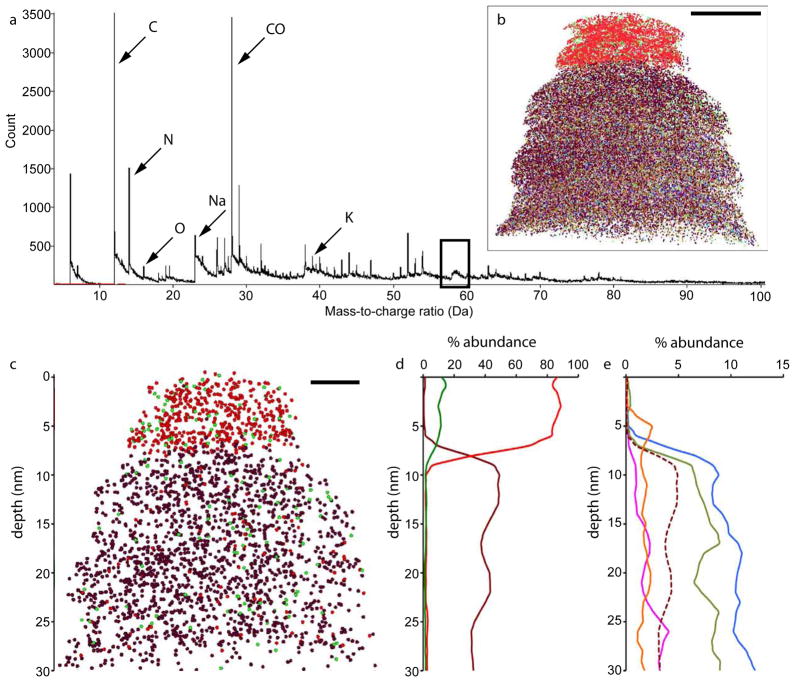
Figure 5. Cellular tips can be accurately reconstructed.
(a) Mass spectrum of first 1.5 × 10⁶ ions field evaporated from the tip, plotted in 0.01 Da bins. The broad peak corresponding to nickel is boxed, and relevant ions plotted in the reconstruction are marked. (b) Corresponding 3D reconstruction of this part of the tip. (c) 10 nm slice from the central plane of the reconstruction, showing distribution of selected ions nickel (red), gallium (green) and carbon (brown). (d) Corresponding plot of % abundance of these ions versus depth along the z axis. (e) Plot of % abundance versus depth of less abundant ions, nitrogen (blue), potassium (green), oxygen (orange) and sodium (pink) of the same slice. Carbon has been plotted as a brown dotted line at 1/10th of its original abundance. Scale bars: b, 10 nm; c, 5 nm.

