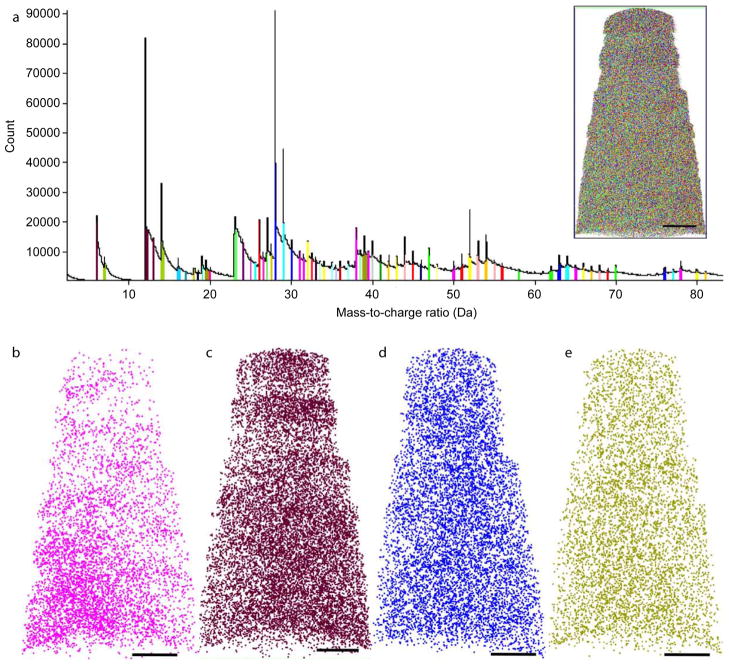
Figure 6. A subset of cellular ions shows spatial heterogeneity at the nano-scale.
(a) Mass spectrum of all ions from the entire tip excepting the metal cap, in 0.01 Da bins. Prominent peaks were chosen and assigned arbitrary colors. (a, inset) Reconstruction of the entire volume, mapping all the prominent ions in the mass spectrum. Several of ions within the cellular sub-volume were mapped, including peaks at m/z (b) 12 Da, labeled C, (c) 23 Da, labeled Na (d) 28 Da, labeled CO, and (e) 39 Da, labeled K. Scale bars 20 nm.

