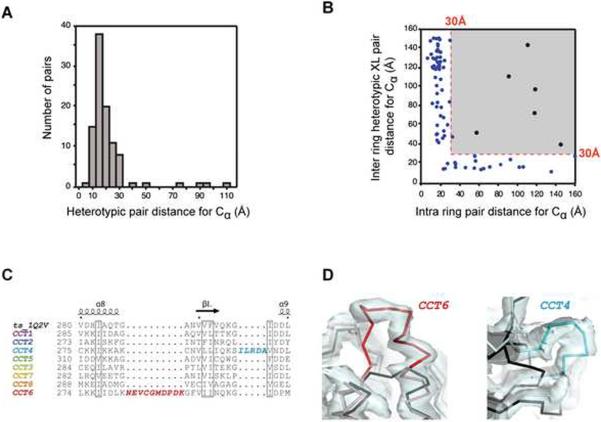
Figure 4. Cross-validation of crystal structure and crosslink data for yTRiC.
(A) Distance distribution for the closed state yTRiC heterotypic crosslink dataset. The median heterotypic Cα-Cα crosslink distance in the model is 16.4 Å. (B) Heterotypic crosslink Cα pair distances for inter ring and intra ring subunit pairings observed in the refined XL-MS-based crystal structure. The crosslinks compatible with the XL-MS arrangement are highlighted in blue; crosslinks mapping to the grey box exceed the cutoff. (C) Alignment showing unique insertions in yTRiC subunits CCT6 and CCT4. (D) Unbiased 2Fo-Fc electron density for these insertions at 1 σ. The thermosome structure is shown in black for comparison. See also Figure S4 and Table S4.

