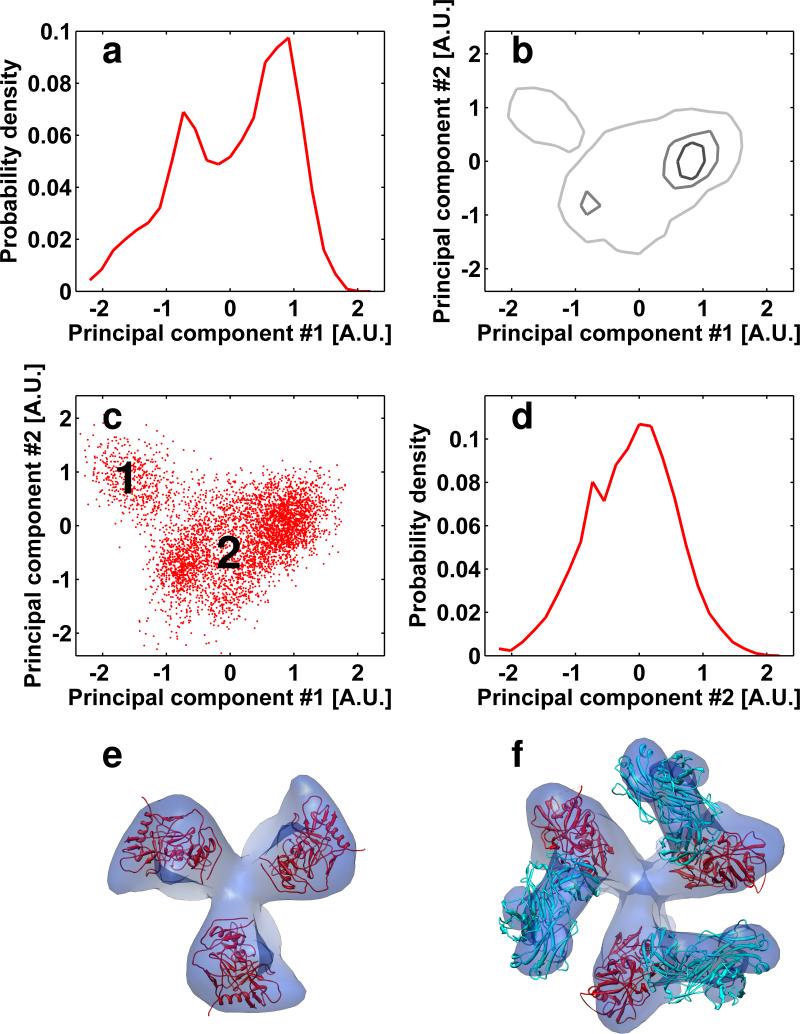
FIGURE 10.
Successful separation of mixed conformations in unliganded and 17b Fab-bound soluble HIV-1 Env spikes. (a-d) Plots of the probability density (a, d) and point cloud distributions (b, c) as defined in Figure 2. The histograms of soluble spikes incubated with the 17b Fab fragments were projected to the 1st and 2nd principal components and visualized as described in the methods section. The maps resulting from averaging the sub-volumes in regions 1 and 2 identified in panel (c) are shown in panels (e) and (f) respectively. (e, f) The map resulting from averaging of sub-volumes in region 1 results in a density map and fitted molecular structure that is essentially the same as that derived for the complex between soluble HIV-1 Env and 17b Fab, and the map resulting from averaging of sub-volumes in region 2 results in a density map and fitted molecular structure that is essentially the same as that derived for unliganded soluble HIV-1 Env spikes (Harris et al., 2011). Molecular structures were obtained by fitting three copies of coordinates for the complex derived from the 1GC1 PDB entry into the density map; coordinates for 17b and gp120 are shown in cyan and red, respectively.

