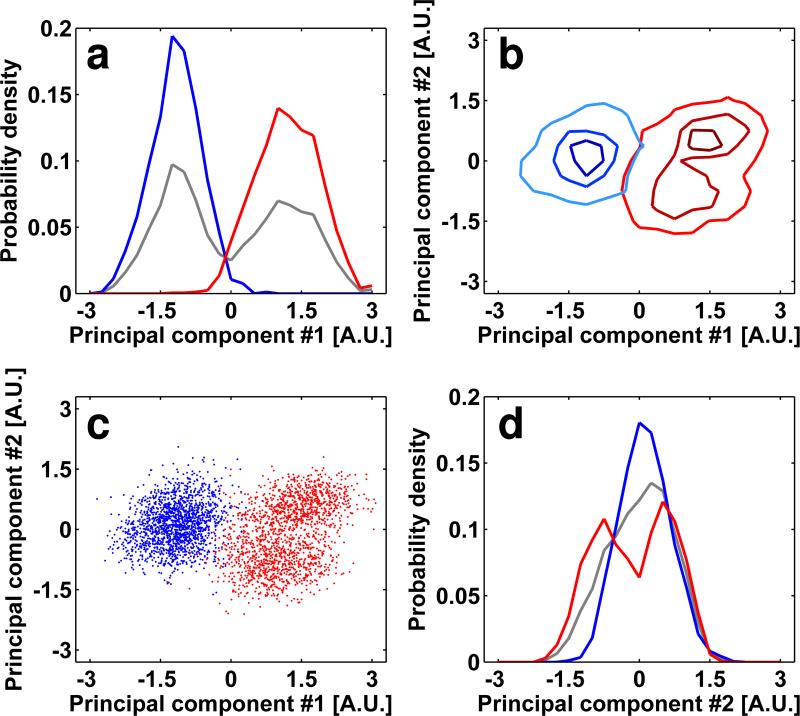
FIGURE 4.
Analysis of the reduced dimensionality representation of the SIVmac239/SIV CP-MAC spike mixture after independent iterative alignment and classification of each dataset. Panels correspond to the point-cloud representation (see Methods section for details) generated by combining the two data sets after they were aligned separately (by six iterations of iterative classification and alignment) followed by alignment of one data set to the other. Lines and markers related to the SIVmac239 sample are colored red and line and markers related to the SIV CP-MAC sample are blue. Gray lines in (a,d) are the normalized histograms of all of the data represented in the mixture. The overlap between the 2D histograms of the SIVmac239 and SIV CP-MAC sub-volumes is only ~13%.

