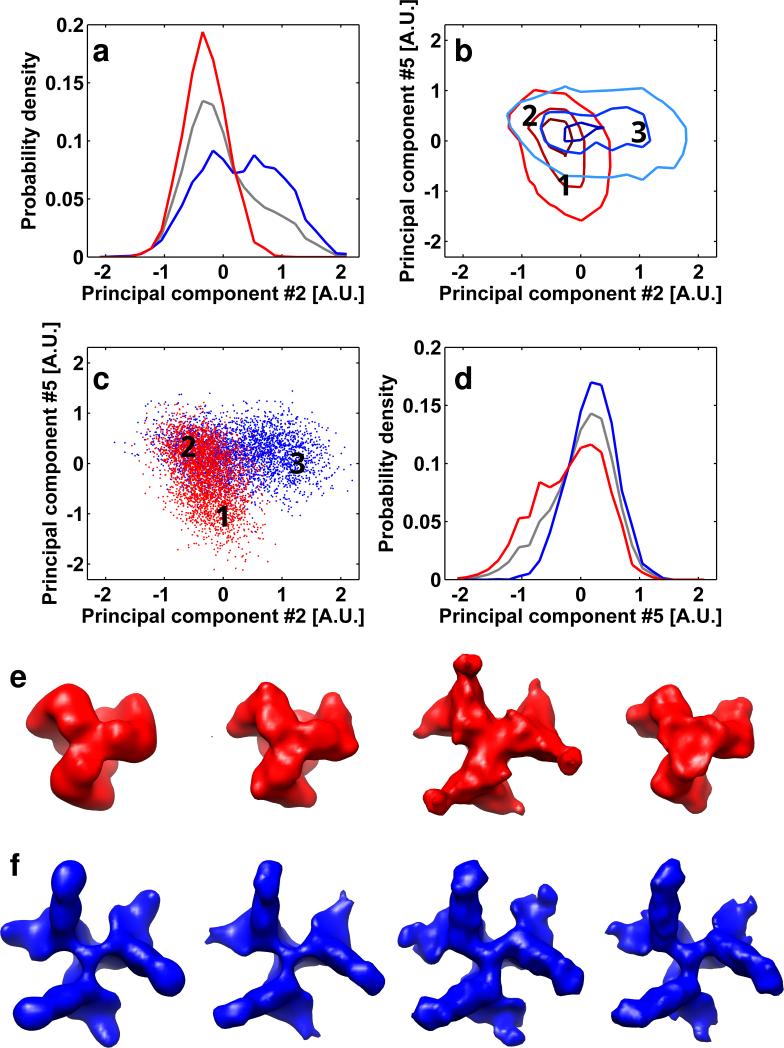
FIGURE 5.
Analysis of geometrical features of the reduced dimensionality representation of the SIVmac239/SIV CP-MAC+sCD4+7D3 mixture. (a,d) The point-cloud is visualized as described in the methods. Red lines and markers are related to the SIVmac239 sample and blue lines and markers are related to the SIV CP-MAC+sCD4+7D3 sample. The gray lines in panels (a) and (d) are the normalized histograms of all of the data represented in the mixture. Sub-volumes from the regions designated by the numbers on the 2D histogram contour plots (panels b and c) were averaged separately. The overlap between the scatter-clouds is ~45%. Three regions were selected for this type of analysis: two regions that contain sub-volumes only from one of the data sets in the mixture, region 1 with SIVmac239 sub-volumes, and region and 3 with SIV CP-MAC+sCD4+7D3 sub-volumes; and one region where sub-volumes from the two data sets reside in the same place (region 2). Top views of the maps resulting from averaging subtomograms originating from SIVmac239 and SIV CP-MAC+sCD4+7D3 data sets are illustrated in panels e (red) and f (blue) respectively. From left to right, the maps in panels (e) and (f) indicate (i) the averaged structures using all of the data, (ii) the maps derived from clearly separated regions of the point cloud, (iii) maps derived from sub-volumes contributing to the overlap region of the point cloud using the orientations assigned by iterative alignment when mixed conformations are present and (iv) maps derived from sub-volumes contributing to the overlap region of the point cloud using orientations assigned by iterative alignment in the absence of mixed data. It is readily apparent that where clear separation was achieved (regions 1 and 2) the resulting average map reliably represents the structure of the respective starting data sets. The assignment of spikes to the region (3) where there is no clear separation is solely due to misalignment, as reflected in the maps resulting from separately averaging the sub-volumes of each original data set while keeping the orientation assigned to them by the iterative alignment process of the mixture. Averaging the same sub-volumes after performing six iterations of alignment and classification solely on theses sub-volumes when they are not in a mixture yield the correct structure.

