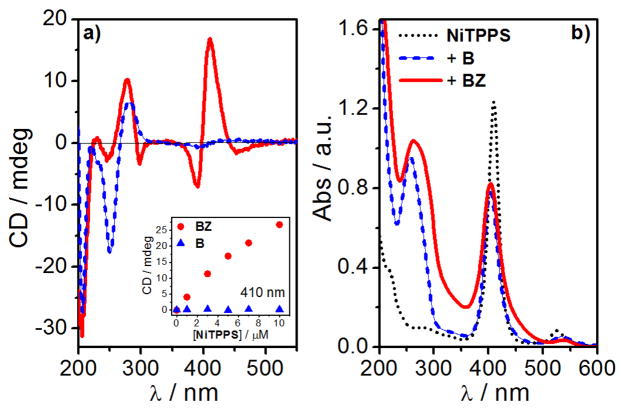
Fig. 3.
(a) CD and (b) UV-vis absorption spectra of NiTPPS (5 μM) alone (black dotted curve) and in presence of BZ (100 μM + 50 mM NiCl2, red curve) and B (100 μM + 50 mM MgCl2, blue dashed curve) in Na- cacodylate buffer (1 mM, pH = 7.0). Inset: CD signal at 410 nm as a function of [NiTPPS] in presence of BZ (red circles) and B (blue triangles) sequences.

