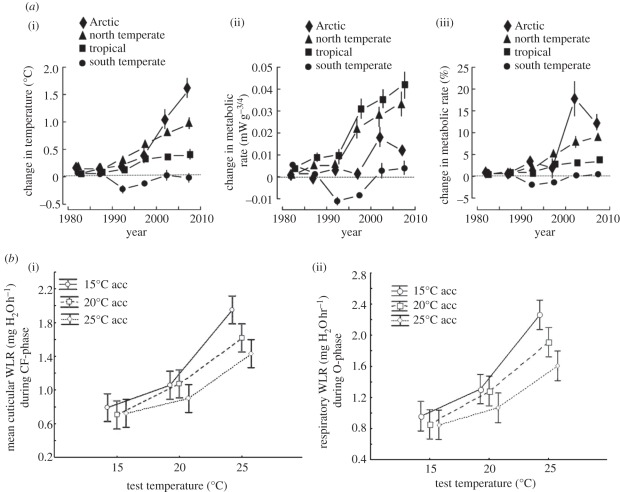
Figure 4.
(a) Global temperature changes and changes in ectotherm metabolic rates between 1980 and 2010. The panels indicate, in order, changes in temperature, mass-normalized metabolic rate and relative changes in mass-normalized metabolic rate, respectively. Adapted from Dillon et al. [91]. (b) Changes in cuticular (i) and respiratory (ii) water loss rates (WLRs) in the dung beetle Scarabaeus spretus at different temperatures and following different acclimation treatments. Redrawn from Terblanche et al. [104].

