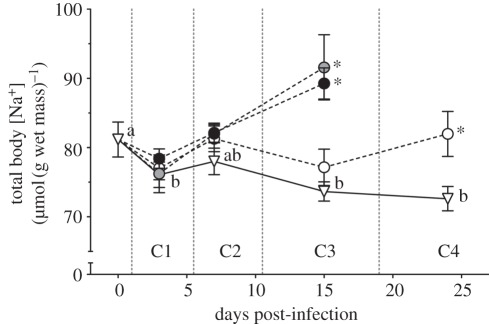
Figure 3.
Total body [Na+] relative to fish wet weight of Glendale River-caught fish artificially infected with L. salmonis copepodids (triangles, control; white circles, one louse; grey circles, two lice; black circles, three lice). Fish were infected one week following transfer to seawater, and sampled over 24 days as both fish and lice developed together. Fish were sampled at times corresponding to each of the four chalimus developmental stages of lice (C1–C4). Louse moulting events are marked by broken vertical lines. Data points represent mean ± s.e.m., n = 10. Asterisks indicate statistically significant differences from time-matched controls; different letters indicate statistically significant differences within the control group (p ≤ 0.05). (From Sackville et al. [12].)

