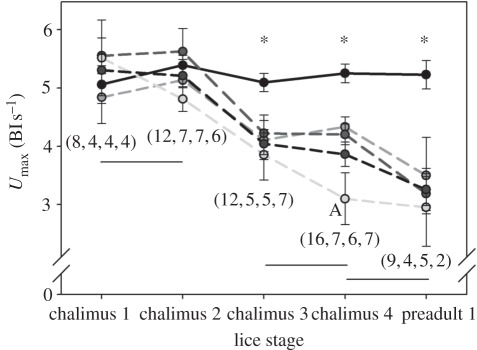
Figure 4.
Maximum swimming performance (Umax) of Glendale River-caught fish artificially infected with L. salmonis copepodids. Control fish (black solid line) and fish with salmon louse infection intensity of one (mid-grey, dashed), two (dark grey), three (light grey) and all infection intensities pooled (black dashed line). An asterisk (*) denotes significant differences between control and infected (pooled or individual) values, while discontinuous horizontal lines denote a difference among the louse development stages (independent of louse intensity) and an uppercase letter indicates the single difference among louse intensity for a given louse development stage. Numbers within parentheses are the number of fish used (reading left to right) for control, 1 louse, 2 and 3 lice per fish, respectively. Values are mean ± standard error of the mean (s.e.m.). (From Nendick et al. [13]).

