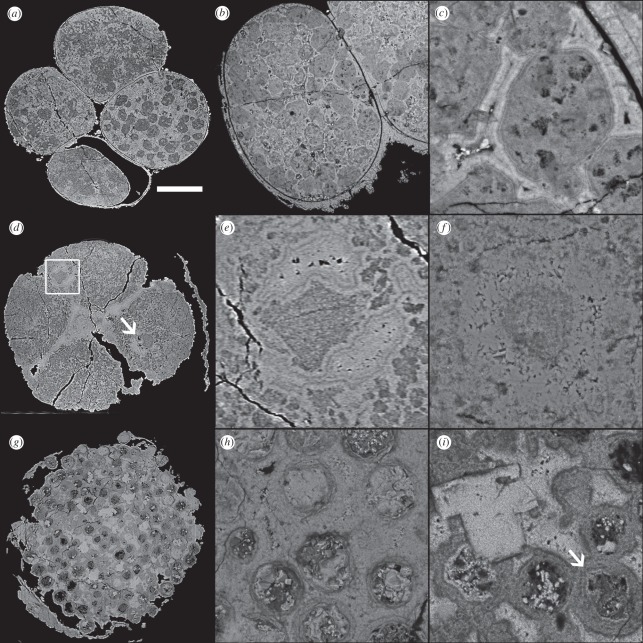
Figure 3.
SRXTM and BSE images of (a–f) ‘Parapandorina’-stage and (g–i)‘Megaclonophycus’-stage cleavage specimens from the Doushantuo biota. (a) SRXTM image of specimen with putatative lipid droplets; note differences in X-ray attenuation between cells owing to preservation quality. (b,c) BSE images. (d,e) SRXTM images of a specimen showing putative nuclei; the square in (d) indicates the region shown in detail in (e). (f) BSE image showing putative nucleus. (g) SRXTM image of ‘Megaclonophycus’ specimen. (h) BSE image of ‘Megaclonophycus’ specimen. (i) BSE image of ‘Megaclonophycus’ specimen, arrow indicates centrifugal growth rings. Scale bar, (a) 123 µm; (b) 92 µm; (c) 17 µm; (d) 133 µm; (e) 21 µm (f) 24 µm; (g) 129 µm; and (h, i) 23 µm.

