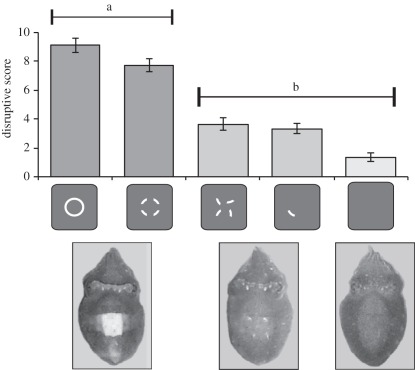
Figure 2.
Graph showing mean disruptive scores determined from body pattern responses to stimuli tested, with error bars giving the standard error of mean. Images below the graph illustrate the general body patterns typical for given stimuli. One-way ANOVA for correlated samples with Tukey's HSD post hoc testing found differences between groups a and b (p < 0.05) but not within them (p > 0.05). Note that the negative control tended to result in a very low disruptive score, corresponding to uniform body pattern, but this was not significantly different from group b responses.

