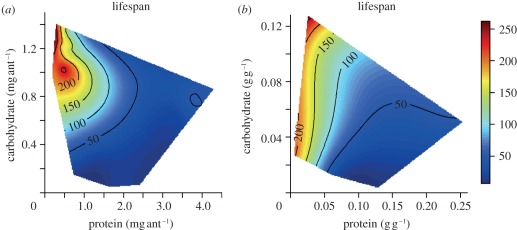
Figure 2.
Performance response surfaces. Data were recorded for ants confined throughout their life to treatments varying in both the ratio and the total amount of protein and carbohydrate (diets used for experiments 1–4). Response surfaces were visualized using non-parametric thin-plate splines, which were fitted using the Fields package in the statistical software R. Red indicates the highest values for the experimental variable on a given response surface, with values descending to lowest values in dark blue regions. (a) Effects of nutrient intake on ant survival (median value for each experimental colony). (b) Effects of nutrient concentration on ant survival. The response surface regression analyses yielded significant relationships as follows: r² = 0.88, F12,115 = 77.92, p < 0.001, and r² = 0.92, F12,107 = 116.69, p < 0.001 for survival as a function of diet intake and diet concentration, respectively (electronic supplementary material, tables S4 and S5).

