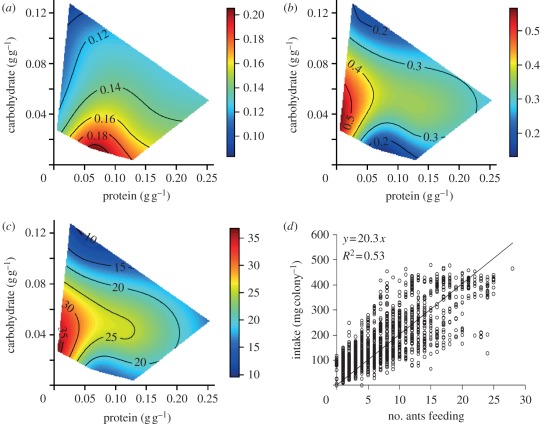
Figure 3.
Activity responses. Effects of dietary composition on (a) proportion of ants in the foraging arena (exploring activity) and (b) proportion of ants in the foraging arena that are feeding (feeding activity; mean value for each experimental colony, n = 21 days of sampling). The response surface regression analyses yielded significant relationships as follows: r² = 0.85, F12,107 = 57.92, p < 0.001, and r² = 0.87, F12,107 = 67.70, p < 0.001 for proportion of ants in the foraging arena and proportion of ants in the foraging arena that are feeding, respectively (electronic supplementary material, table S5). (c) Effects of nutrient concentration on the total diet intake measured across 21 days (r² = 0.95, F12,107 = 177.87, p < 0.001; electronic supplementary material, table S5). (d) Effect of number of ant feeding on colony diet intake. The model investigating the effect of number of ants feeding, protein concentration, carbohydrates concentration and colony on the colony intake was significant (F13,2506 = 106.37, p < 0.001), and accounted for 36% of the variance. Examination of the standardized regression coefficients shows that the main effect on colony intake was due to number of ants feeding (see electronic supplementary material, table S6).

