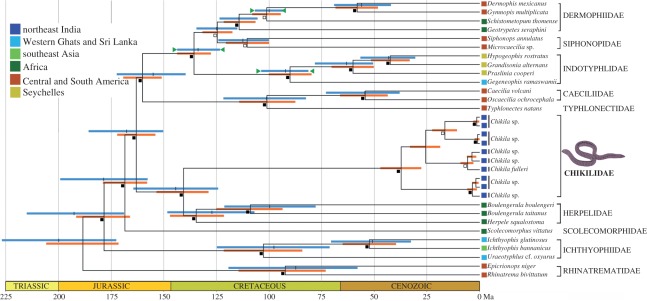
Figure 2.
Timetree of caecilian amphibians. Age estimates and confidence intervals (horizontal bars) of the divergences among Chikila gen. nov. and other extant caecilians. The timetree depicted is the unique supertree that displays both of the entirely compatible trees found in two analyses: (i) analysis of 12 413 bp of complete mt genome and two nuclear genes (rag1 and slc8a1) for one Chikila fulleri plus 22 other caecilians, and (ii) analysis of 1982 bp of mt cox1 + 16S for 10 Chikila plus the 22 other caecilians. Blue and orange bars are confidence intervals from analyses (i) and (ii), respectively. Green triangles indicate calibrations (upper and lower bounds) for analysis (i). Filled squares next to nodes indicate maximal support for Bayesian inference (BI) and maximum likelihood (ML); open squares indicate maximal support for BI and high (>90%) for ML. Colour codes of leaves correspond to geographical region. See Estimation of Divergence Times in the electronic supplementary material for details.

