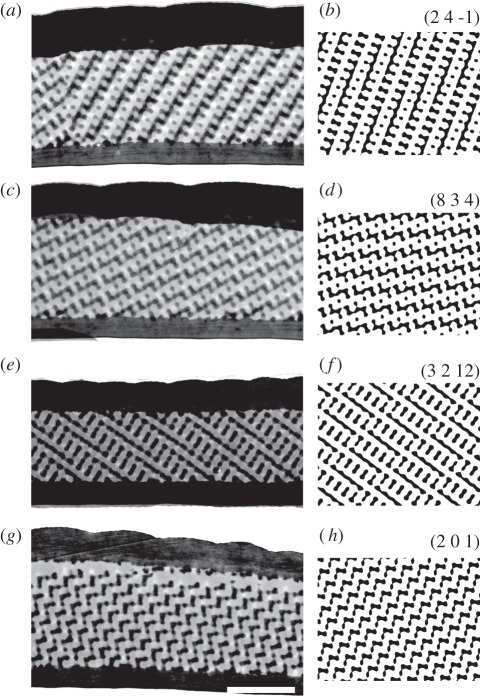
Figure 2.
TEM of single scales revealing different orientations. The left column (a,c,e,g) shows a side-view of four different scales (bar: 2 μm, in g). The right column (b,d,f,h) shows the matching crystal orientations of a single-diamond crystal with a chitin-filling fraction approx. 0.3 and thickness 0.2a (a is the lattice constant). The orientations are given by the Miller indices (h k l) above each simulated cross section.

