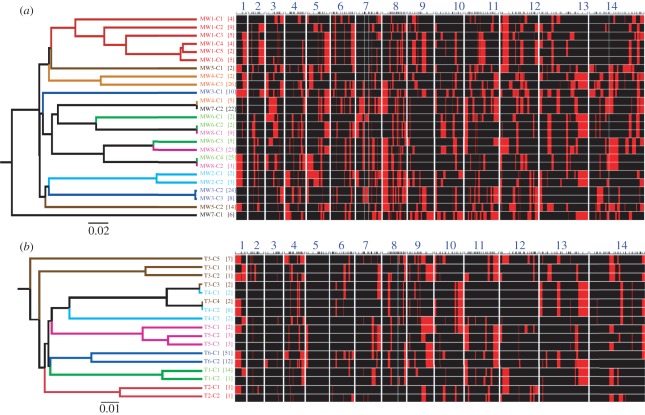
Figure 2.
Haplotype structure of parasites within MIs. Haplotypes recovered from MIs in (a) Malawi and (b) Thailand. Chromosome blocks marked by major and minor SNP alleles are shown in black and red, respectively (right panel), with numbers 1–14 representing the 14 P. falciparum chromosomes. The locations of genotyped SNPs are shown by tick marks above each chromosome. UPGMA tree (left panel) shows clustering of haplotypes based on allele-sharing. Patient codes (MW1–8 from Malawi and T1–6 from Thailand) are shown on the right of the tree, while the tree branches and labels are coloured to reflect the patient from which each parasite haplotype was recovered. Square brackets contain the number of clones isolated for each haplotype.

