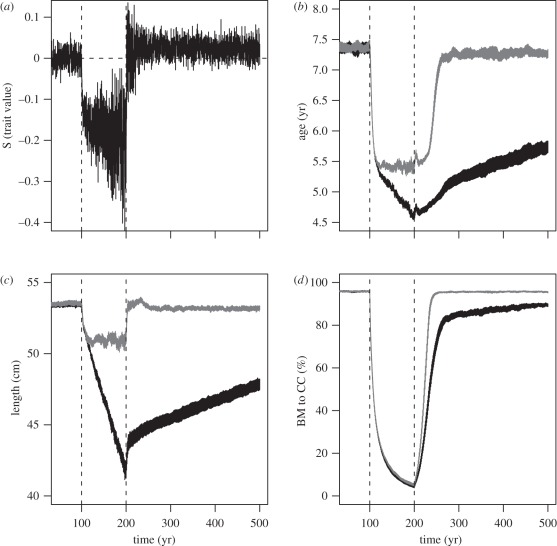
Figure 1.
Selection differentials and changes in life-history traits and population biomass during the simulation period. Selection differentials (S) on the trait value coding the life history are shown in (a), whereas age and length at maturity are given in (b) and (c), respectively, and biomass-to-carrying-capacity ratio (BM to CC) in (d). Black shade denotes evolution and grey shade denotes no evolution. Shaded areas encompass 95% CI of the averages of 20 replicated simulation runs. Dashed vertical lines indicate the beginning and the end of fishing. Runs are repeated with a model that allows the life histories to evolve as well as with a model that does not allow evolution, as indicated in the legend, except that selection differentials are only shown for the evolving population.

