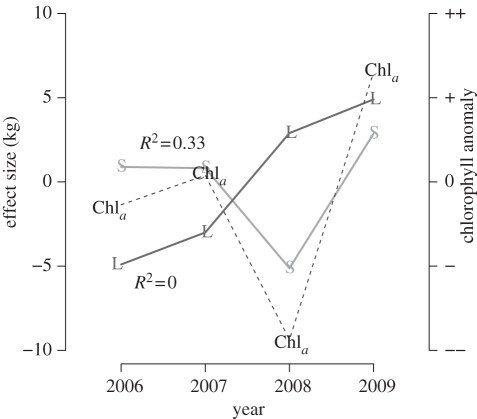
Figure 3.
Year effect on the weaning mass of each estimated group of pups: S and L stand for small and large weanlings, respectively. The two groups differed in their response to environmental conditions. Yearly deviations from mean weaning mass for small pups, but not for large pups, positively covaried with cumulated chlorophyll a anomalies in the interfrontal zone. Solid lines correspond to posterior means.

