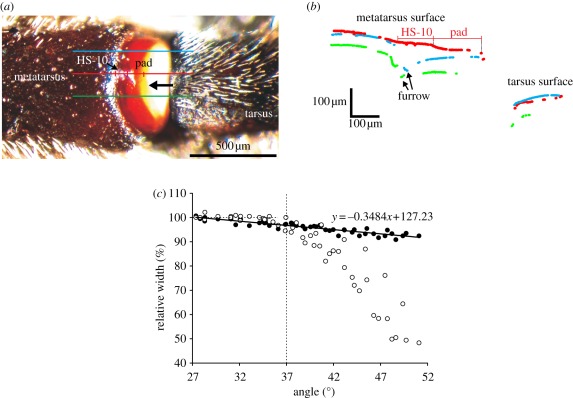
Figure 8.
(a) Dorsal view of the metatarsus–tarsus leg joint with the metatarsal lyriform organ HS-10. At stimulation, the tarsus pushes against the pad on the metatarsus (black arrow) compressing the slits of organ HS-10 perpendicular to their long axes. The colour lines indicate the surface profiles shown in (b). (b) White light interferometric surface profiles taken along the leg's long axis as indicated in (a). The lines of the profiles are broken because of invalid data points. The straight thin red line indicates the length of organ HS-10 and of the cuticular pad in the profiles used for the measurements shown in (c). The blue and the green lines show the surface profiles taken anteriorly and posteriorly of the lyriform organ (see (a)), and clearly represent the furrow between the soft pad and the well-sclerotized cuticle of the metatarsus. (c) Width of organ HS-10 (filled circles) and of the pad (open circles) under increasing load drawn as percentage of the width (100% at 27° tarsal deflection). From an angle of 37° onward, the pad is clearly compressed more than the lyriform organ.

