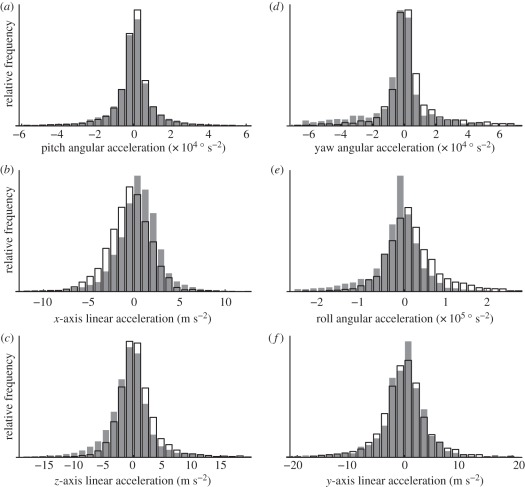
Figure 11.
Histograms showing how the distributions of the body kinematic parameters are associated with the state of the alula. (a–c) Symmetric body accelerations; (d–f) asymmetric body accelerations. The data have been categorized according to the state of both alulae: (a–c) either both flat (shaded) or both flipped (unshaded); (d–f) either left alula flipped and right alula flat (shaded) or right alula flipped and left alula flat (unshaded).

