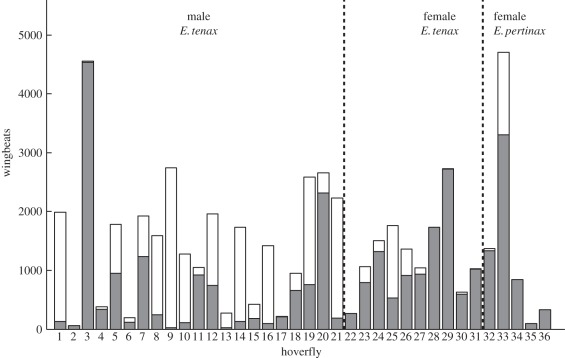
Figure 6.
Number of wingbeats and frequency of alula flipping for n = 36 hoverflies. The height of the bars indicates the total number of wingbeats measured for each individual, treating measurements for the left and right wings as separate datapoints in this figure. The lower, shaded part of each bar shows the number of wingbeats where the alula was flat; the upper, unshaded part of the bar indicates wingbeats where the alula was flipped. All of the hoverflies had wingbeats where the alula was flat; only five hoverflies did not have the alula flipped on any wingbeats.

