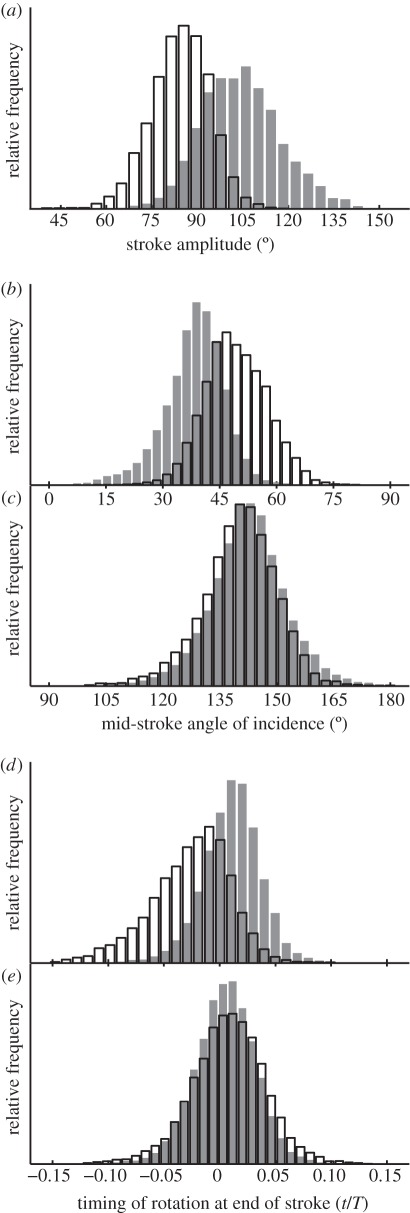
Figure 7.
Histograms showing how the distributions of several key wing kinematic parameters are associated with the state of the alula. The data have been categorized according to the state of the alula; flat (shaded bars) or flipped (unshaded bars) and pools data from the left and right wings. (a) Downstroke stroke amplitude; (b) mid-downstroke angle of incidence; (c) mid-upstroke angle of incidence; (d) timing of supination at the end of the downstroke; (e) timing of pronation at the end of the upstroke. The timing of rotation is expressed as a fraction of the total stroke period (t/T), and is measured relative to the timing of stroke reversal.

