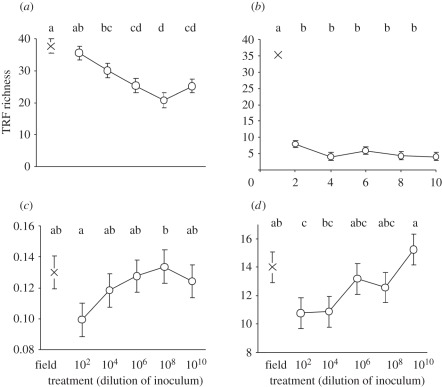
Figure 3.
Genotypic, phenotypic and functional profiles of soils experimentally manipulated to produce a graded series of biodiversity by inoculating sterile soil with a dilution series of non-sterile (source) soil across 10 orders-of-magnitude and incubating for 14 months [Symbol O]. The symbol X denotes equivalent data for the unsterilized soil (‘field’) from which the dilution series was derived. (a) Number of distinct eubacterial T-RFLP fragments; (b) number of distinct fungal T-RFLP fragments; (c) fungal : bacterial biomass ratio derived from phospholipid fatty acid (PLFA) profile; (d) porosity at 9 µm scale derived from X-ray tomography imaging of undisturbed soils. Points show means (n = 5); bars show standard errors (in part (b), these fall within the confines of the symbols). Within each panel, points labelled by the same letters are not significantly different using the Fisher multiple-ranges test in ANOVA.

