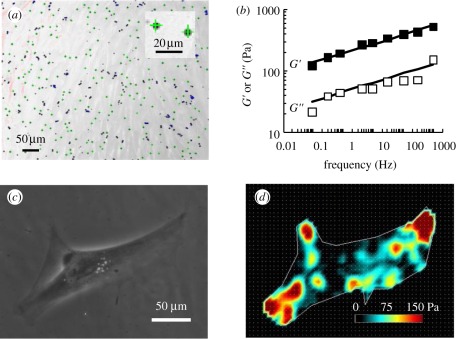
Figure 1.
SC cells exhibit power-law rheology and exert traction forces on a deformable substrate. (a) A typical micrograph showing 4.5 µm magnetic beads adhered to a monolayer of SC cells during an OMTC measurement. The green crosses indicate real-time tracking of bead centroids. Inset: close-up of two beads. (b) The representative cell strain SC51 exhibits power-law rheology behaviour across four orders of magnitude in frequency. See §5 for definitions of G′ and G″; each data point is median over 598 magnetic beads; the error bars for standard errors are smaller than data symbols. The straight lines represent fitting using a two-parameter power-law rheology model (see text for details). (c,d) A representative SC cell from cell strain SC51 exerts traction when plated on a deformable substrate. Phase-contrast image is shown in (c) and traction intensity map in (d).

