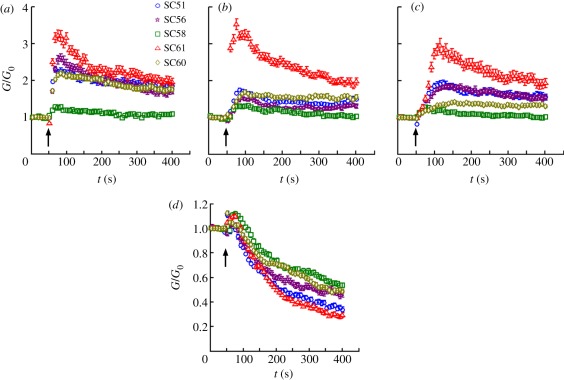
Figure 3.
SC cells stiffen in response to (a) S1P, (b) LPA, (c) thrombin, and (d) soften in response to latrunculin A. At concentrations of 0.1 µM for latrunculin A, LPA and S1P, and 0.1 µ-NIH unit ml−1 for thrombin, the treatments were applied at 50 s, indicated by the arrows. G/G0: current cell stiffness (G) normalized by the baseline stiffness (G0). All cells were tested at passage 2, except for the responses of SC58 and SC61 to thrombin, which were tested at passage 3. Each data series is median value of over 300 beads; the error bars are standard errors (which are often masked by the data symbols).

