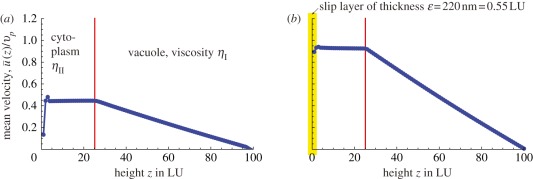
Figure 2.
(a) The ratio of average fluid velocity over average particle velocity  for a no-slip wall below the vesicles. (b) Partial slip at the bottom wall, corresponding to a layer of lower viscosity and of thickness 220 nm (or 0.55 LU) close to the wall, can explain the high fluid velocities observed in experiments. Viscosity ratio is ηII/ηI = 50 and particle surface coverage ϕ = 0.1, with the distance between actin bundles being Δy = 5 LU corresponding to 2 µm. The height of the cytoplasm is Hcyto = 25 LU = 10 µm. (Online version in colour.)

