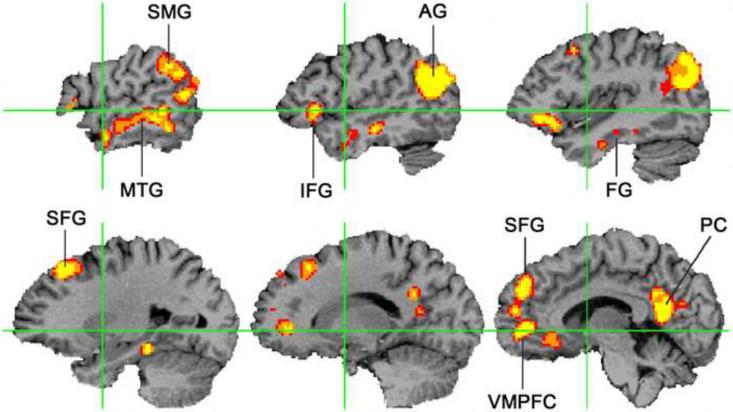
Figure 2. Meta-analysis of functional imaging studies of semantic processing.
This figure displays brain regions reliably activated by general semantic processes, based on reported activation peaks from 120 independent functional imaging studies (p <.05 corrected for family-wise error). The analysis method assigns a significance value to the degree of spatial overlap between the reported activation coordinates in a standard volume space. The figure shows selected sagittal sections in the left hemisphere; right hemisphere activations occurred in similar locations but were less extensive. AG = angular gyrus, FG = fusiform gyrus, IFG = inferior frontal gyrus, MTG = middle temporal gyrus, PC = posterior cingulate gyrus, SFG = superior frontal gyrus, SMG = supramarginal gyrus, VMPFC = ventromedial prefrontal cortex. Green lines indicate the Y and Z axes in standard space. Adapted from [47].

