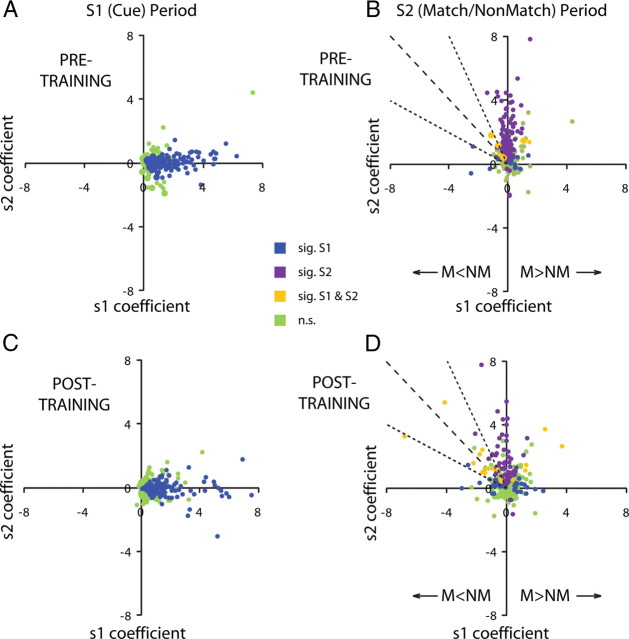
Figure 7.
Regression analysis. A, Responses recorded during the cue period, before training. Each dot represents the s1 and s2 regression coefficients of a single neuron. Blue dots represent neurons with significant s1 coefficients (i.e., significantly modulated by the location of the cue); green dots represent neurons with no significant s1 coefficients. B, Responses recorded during the second stimulus presentation period. In addition to blue and green dots, purple dots represent neurons with significant s2 coefficients (i.e., significantly modulated by the location of the second stimulus). Orange dots represent neurons with both significant s1 and s2 coefficients. C, D, Equivalent responses of neurons recorded after training. Up to three outliers appeared beyond the axis range in each panel. M, Match; NM, non-match.

