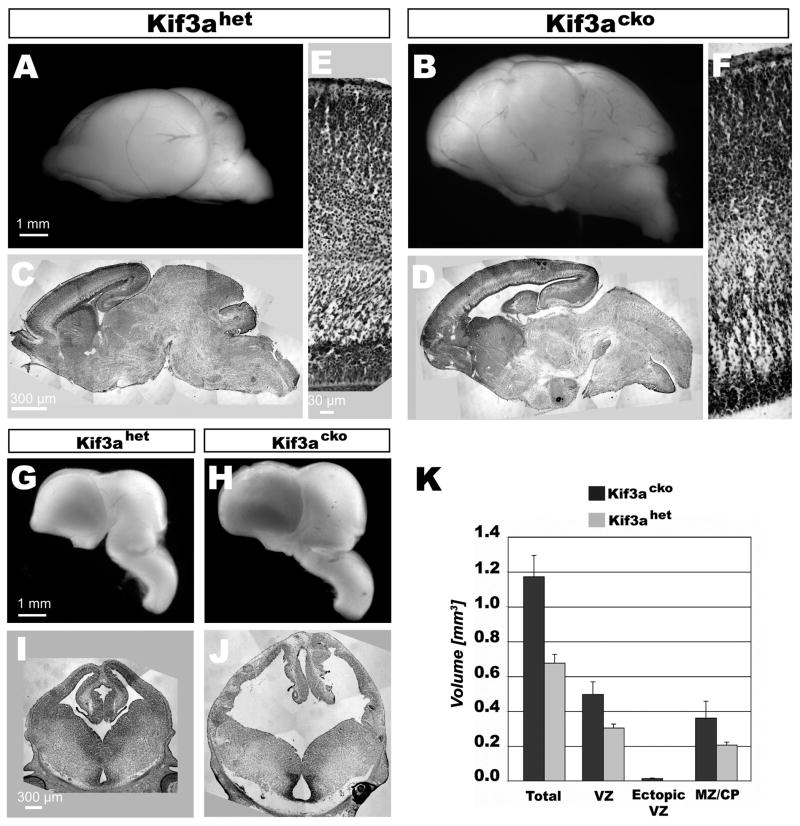
Figure 1. Kif3acko cortices are 1.75x larger than in Kif3ahet mice.
(A and B) Kif3acko cortices at P0 are large and bumpy. (C and D) Nissl staining of sagittal sections of Kif3acko brains reveal ectopic cell clusters in the cortical plate. (E and F) 20x magnification of region in (C and D) shows that Kif3acko cortices contain relatively normal layers in regions without ectopic cells disruptions. (G–J) Mature phenotype is present by E13.5. (K) Stereological calculation of volume increase in Kif3acko compared to Kif3ahet. Error bars are standard deviations of three brains.

