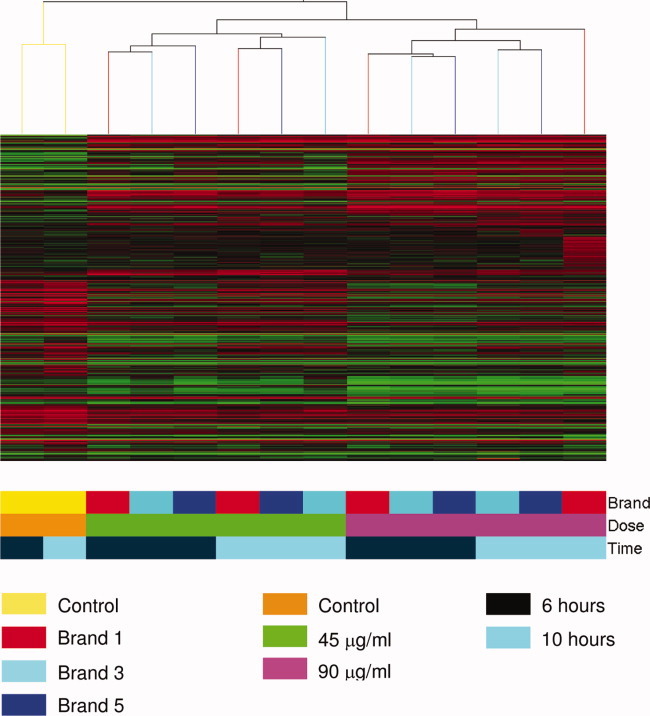
Fig. 4.

Heat map of the mean expression of the 328 differentially expressed probes across the concentrations, time points and brands. Red represents high expression relative to the reference sample, and green represents low expression relative to reference. The cluster analysis reveals that the expression profiles cluster first by concentration, followed by treatment.
