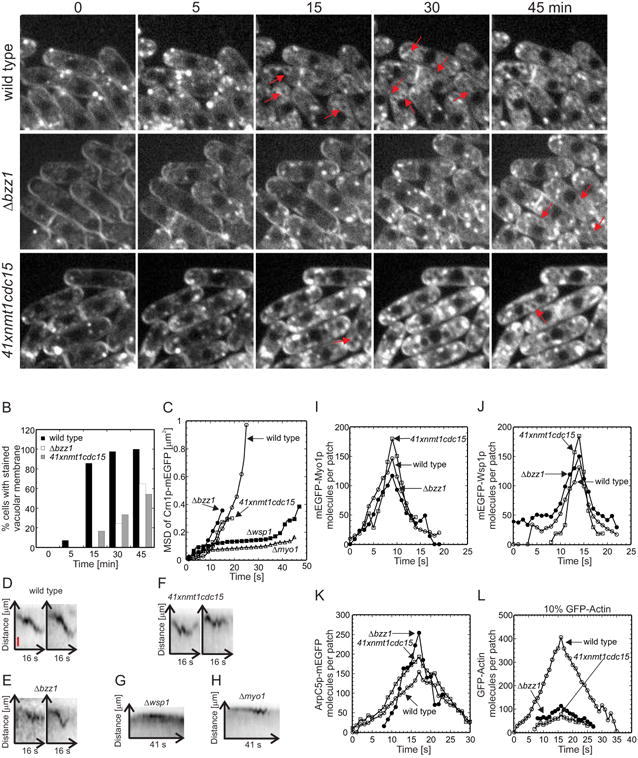
Figure 2. Effects of Bzz1p deletion or Cdc15p depletion on endocytosis and accumulation and loss of Myo1p, Wsp1p, Arp2/3 complex and actin, in actin patches.

(A) Uptake of the fluorescent dye FM4-64 by endocytosis. Wild type, Δbzzl and 41xnmt1cdc15 cells were incubated on ice for 15 min to block endocytosis, exposed to 20 μM FM4-64 in YE5S at 4° C for 15 min and shifted to 25° C to restart endocytosis. The images are single optical sections through the middle of the cells at different time points. Red arrows mark fluorescent vacuolar membranes. The rows show (top) wild type cells, (middle) Δbzz1 cells and (bottom) 41xnmt1cdc15 cells depleted of Cdc15p. Scale bar 5 μm. (B) Quantitative analysis of endocytosis by scoring cells in time lapse movies that concentrated FM4-64 dye in the vacuolar membranes: (black bars) wild type cells (n= 42), (white bars) Δbzz1 cells (n= 39) and (grey bars) 41xnmt1cdc15 cells (n=24). (C - H) Movements of actin patches tagged with coronin Crn1p-mEGFP in wild type and mutant cells. (C) Mean square displacement (MSD) of the diffraction-limited spot of Crn1p-mEGFP fluorescence over time. Symbols: (o, n = 10) wild type cells; (•, n = 12) Δbzz1 cells lacking Bzz1p; (□, n = 13) 41xnmt1cdc15 cells depleted of Cdc15p; (▪, n = 12) Δwsp1 cells lacking Wsp1p; and (Δ, n = 11) Δmyo1 cells lacking Myo1p. (D - H) Kymographs of individual Crn1p-mEGFP patches from five confocal sections imaged at 1 s intervals. A 24 × 14 pixel box was sum projected into a 24 × 1-pixel vertical lane and 16 lanes (D - F) or 41 lanes (G - H) were combined horizontally to generate negative contrast kymographs. (D) Wild type cells, (E) Δbzz1 cells, (F) 41xnmt1cdc15 cells, (G) Δwsp1 cells and (H) Δmyo1 cells. Vertical red bar is 100 nm. (I - L) Time courses of the accumulation and loss of actin patch proteins at 25°C in (○) wild type cells, (•) Δbzz1 strains lacking Bzz1p and (□) 41xnmt1cdc15 cells depleted of Cdc15p. (I) mEGFP-Myo1p was expressed from the native locus and the numbers of molecules per patch were tracked over time in wild type cells (n = 21 patches), 41xnmt1cdc15 cells (n = 15) and Δbzz1 cells (n = 12). (J) mEGFP-Wsp1p was expressed from the native locus and the numbers of molecules per patch were tracked over time in wild type cells (n = 12 patches), 41xnmt1cdc15 cells (n = 23) and Δbzz1 cells (n = 18). (K) The Arp2/3 complex subunit ArpC5p-mEGFP was expressed from the native locus and the numbers of molecules per patch were tracked over time in wild type cells (n = 12), 41xnmt1cdc15 cells (n = 7) and Δbzz1 cells (n = 8). (L) GFP-actin was expressed from the leu+ locus in the presence of wild type levels of native actin from a 41× nmt1 promoter in (○) wild-type cells, (•) Δbzz1 cells lacking Bzz1p and (□) from a 3× nmt1 promoter in 41xnmt1cdc15 cells. The numbers of molecules per patch were tracked over time.
