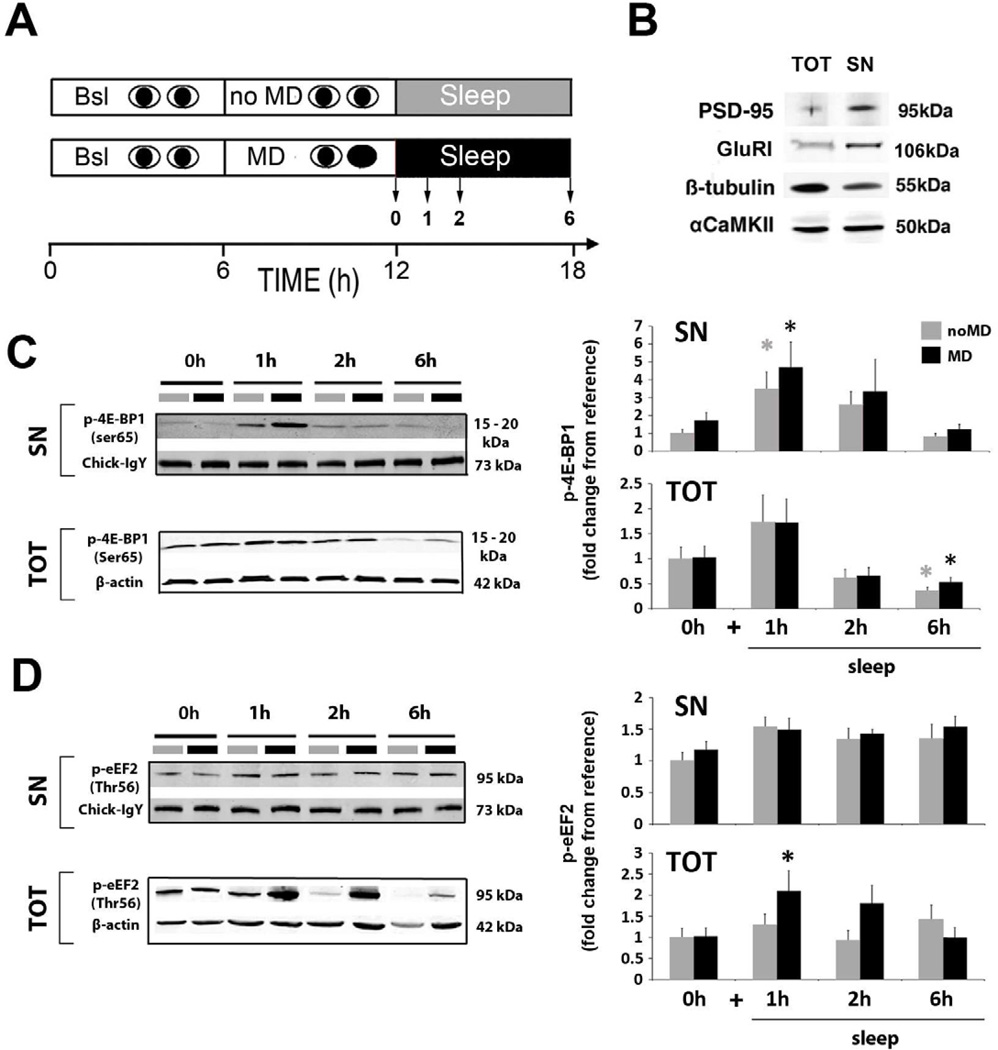
Figure 2. Sleep and waking experience affect phosphorylation of translation factors.
(A) Experimental design for the main groups: MD (black bars) or normal binocular vision (noMD control: grey bars) was combined with 0 (i.e. MD only and noMD only) or 1, 2 or 6 hours ad lib sleep. V1 was then harvested and processed separately for total mRNA extraction (see Figure 3A) and total (TOT) / synaptoneurosome (SN) protein extraction.
(B) Validation of synaptoneurosome enrichment. Representative immunoblots showing enrichment of PSD-95 and GluRI protein level [37], decreased ß-tubulin [38] and unchanged αCaMKII [39] expression in the SN preparation compared to total protein extract in the same V1 sample. Equal amounts (40μg) of protein were loaded for both fractions.
(C,D) Representative Western bots (left panels) and quantification of pooled data (right graphs) showing changes in phosphorylation state for 4E-BP1 (C) and eEF2 (D) in SN and TOT protein fractions.
(C) Translation initiation, via 4E-BP1 phosphorylation (Ser65), increased in the first hour of sleep in both noMD and MD groups, but this was only significant in the SN fraction (1-Way ANOVA: noMD groups: H = 15.33, p = 0.002; MD groups, H = 12.75, p = 0.005, * p < 0.05 Dunn’s test). In the TOT fraction there was a significant decrease in p-4E-BP1 after 6 hours of sleep compared to wake in both noMD and MD groups (1-way ANOVA: noMD groups, H = 11.69, p = 0.009; MD groups, H = 10.24, p = 0.017, * p < 0.05 Dunn’s test).
(D) Translation elongation arrest, via eEF2 phosphorylation (Thr56), was enhanced after MD+1h sleep, in the TOT fraction, but not in synaptic enriched fractions (1-Way ANOVA: MD groups, H = 11.29, p = 0.01, * p < 0.05, Dunn’s test).
Normalizing procedures are described in Supplemental Experimental Procedure. Between 8–20 samples were used per condition (Table S3 for details). All values are represented as means ± s.e.m.

