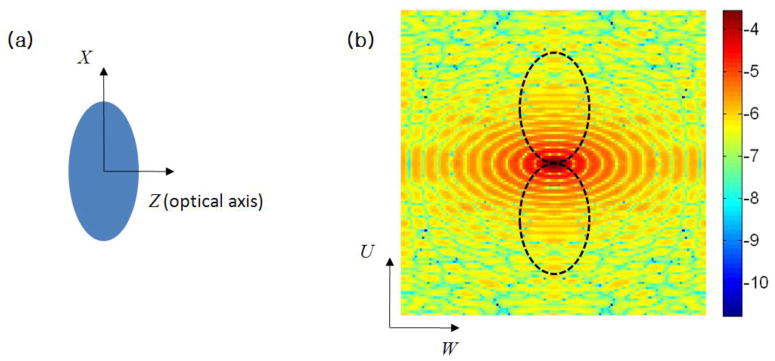
Figure 6.
(a) A spherical bead squashed in the optical axis direction with the aspect ratio of 2 to 1, (b) spatial frequency spectrum of (a), in which the frequency support of the transfer function for the angular coverage from −60° to 60° is drawn as a dotted line. The color bar indicates the amplitude of the spectrum in the logarithmic scale with base 10.

