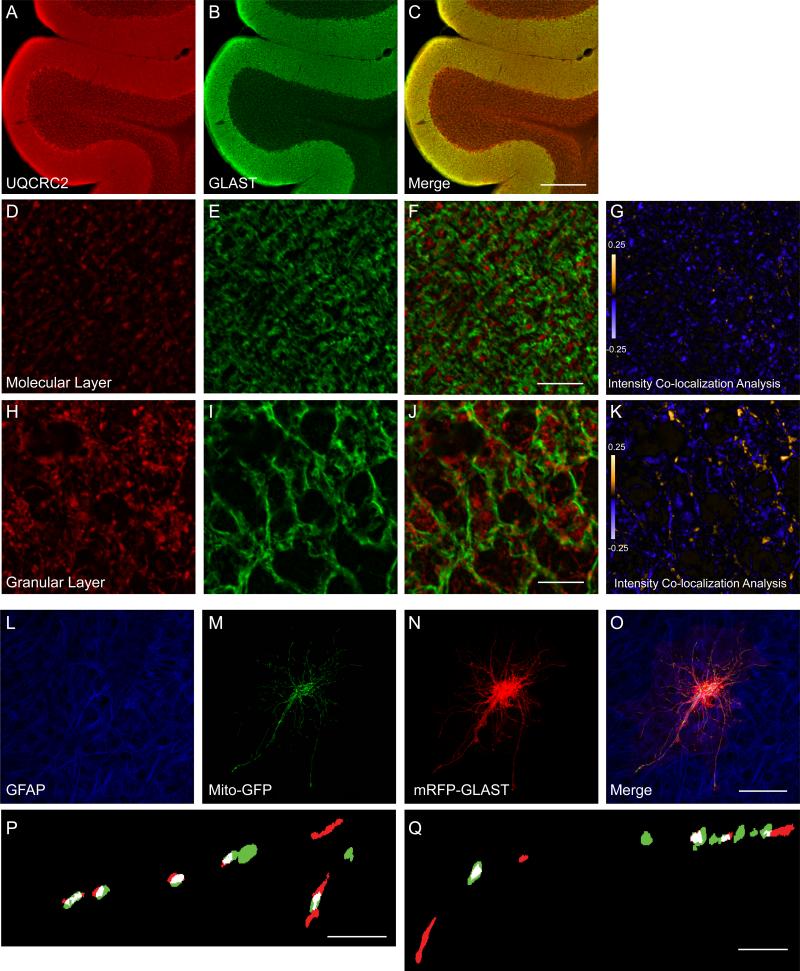
Figure 4. Co-localization of GLAST with mitochondria in cerebellum (A-K) and in biolistically transduced astrocytes in organotypic hippocampal slice cultures (L- Q).
A-C. Representative images from adult rat cerebellum immunostained with antibodies against UQCRC2 (A; red) and GLAST (B; green). C. Merged image of GLAST and UQCRC2 immunofluorescence. Scale bar = 300 μm. D-K. Higher magnification views of the molecular layer (D, E) and granular layer (H, I) of the cerebellum immunostained for UQCRC2 (red; D, H) and GLAST (green; E, I) and merged (F, J). Scale bar = 10 μm. G, K. Pseudocolor representatations of PDM values for the image pairs (D:E and H:I), where pixel intensity is equal to the PDM value at that location. Images with positive PDM value are displayed in yellow, while those with negative values are displayed in violet. L-Q. Co-localization of mitochondria and GLAST in the processes of astrocytes in slice culture. Representative images of astrocytes in slice culture immunostained for glial fibrillary acidic protein (L; GFAP; blue) and transfected with the cDNAs encoding Mito-GFP (M, green) and mRFP-GLAST (N, red) and a merged image (O). P, Q. Binary, higher magnification view of astrocyte processes. Overlapping pixels are indicated in white.

