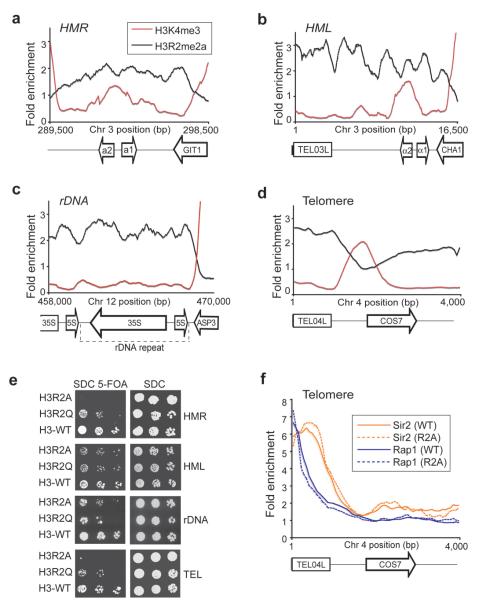
Figure 1. H3R2me2a associates with heterochromatin.
(a-d) ChIP-on-chip analysis was performed in wild-type yeast cells (BY4741) grown to mid-log phase using antibodies to H3R2me2a and H3K4me3. The graphs show a moving average (window=15, step=1) of the H3R2me2a and H3K4me3 enrichment normalized to histone H3 occupancy at the right (HMR) and left mating type cassettes (HML), at the silent ribosomal DNA repeat region (rDNA) and at the left telomere of chromosome 4 (TEL04L). Values less than 1 represent regions that are not enriched. The arrows at the bottom of the graphs represent the location of genes and the direction they are transcribed. The rectangles at the bottom of the graphs correspond to the telomeric sequences. (e) Heterochromatin silencing assays were performed using cells from the H3R2A, H3R2Q, and isogenic wild-type (H3) yeast strains. Plates were photographed after 48 h incubation at 30 °C. (f) ChIP-on-chip analysis on telomeres using antibodies against Sir2p and Rap1p in WT and H3R2A strains. The graph shows a moving average (window=15, step=1) of the antibody enrichment as a ratio to Input at TEL04L.

