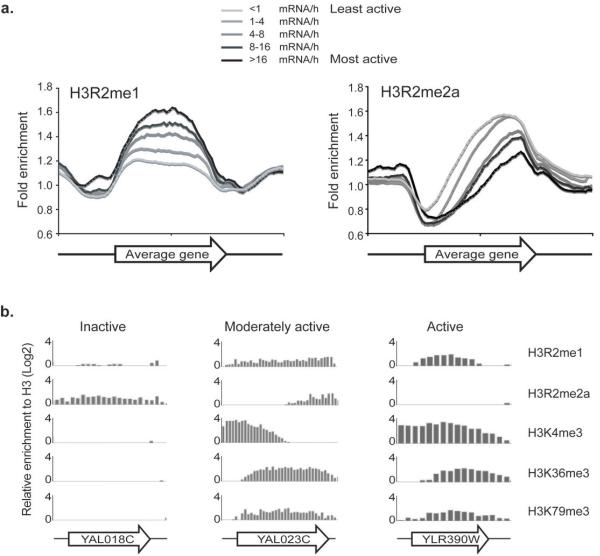
Figure 2. H3R2me1 associates with transcriptional activation.
(a) Composite profiles of ChIP-chip experiments. (b) ChIP-chip analysis compares the distribution of various histone methyl marks across three differentially expressed genes. The H3R2me2a and H3K4me3 data have been previously described 8.

