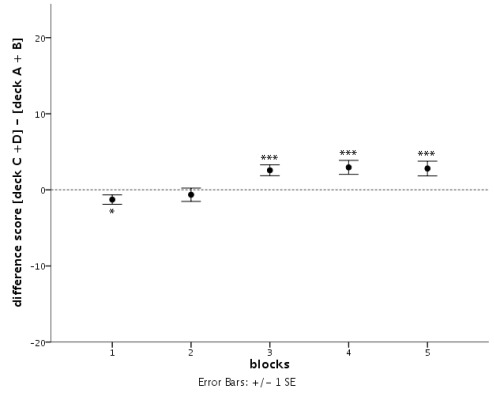
Figure 1.
Development of the difference score between the sum of cards drawn from advantageous decks C and D and disadvantageous decks A and B over five consecutive blocks of 20 cards of the Iowa Gambling Task. Bars represent SE of the mean (SE), asterisks indicate the level of significance: *p < 0.05, ***p < 0.005 (Student’s t-test against zero).

