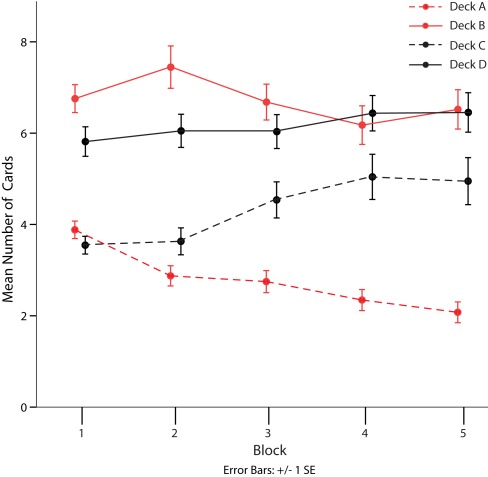
Figure 2.
Mean number of cards drawn from each deck of the Iowa Gambling Task over five consecutive blocks of 20 choices. Red lines indicate decks identified as disadvantageous in the original publication of the task. Solid lines identify decks with high gain frequency, broken lines those with low gain frequency. Bars represent SE of the mean (SE).

