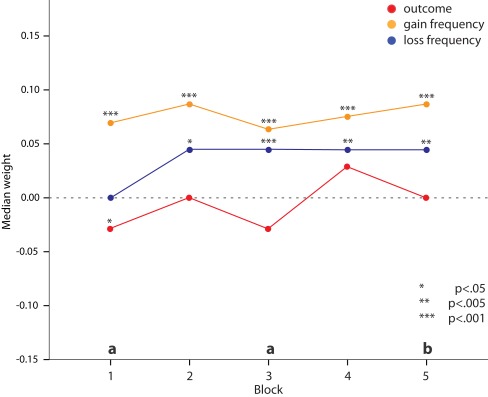
Figure 3.
Estimated median weights for the features long-term outcome (red), gain frequency (orange), and loss frequency (blue) over the five consecutive blocks of 20 choices based on all participants. Asterisks indicate the level of significance of Wilcoxon signed rank test against zero, a (p < 0.001), and b (p < 0.005) indicate the level of significance of Friedman tests comparing the weights within each block.

