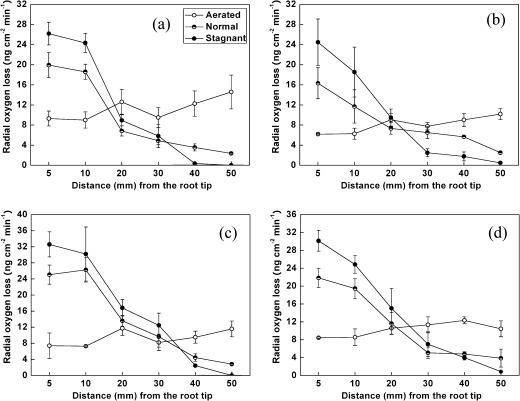
Fig. 2.
Spatial patterns of ROL along the roots of rice of four genotypes, IAPAR9 (a), Nanyangzhan (b), TD71 (c), and TORO2 (d) subjected to different aeration conditions (aerated, stagnant, and normal nutrient solutions) for a growth period of 30 d. Values are shown as means ±standard deviation (SD).

