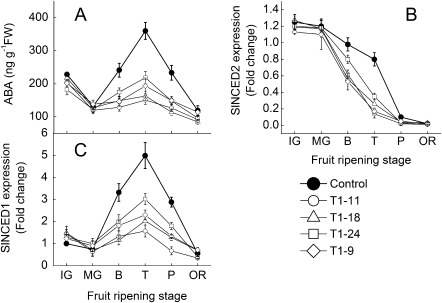
Fig. 2.
Expressions of ABA biosynthesis genes and changes of ABA content during fruit development in RNAi transgenic and control fruit. Data include four transgenic lines of the T1 generation. SAND expression is shown as an internal loading control. Fifteen fruits were harvested randomly at each stage from each transgenic line and control plants and then divided into three groups (five for each) as three replications. Data are means ±SD (n=3). IG, immature green; MG, mature green; B, breaker; T, turning; P, pink; OR, over red.

