Fig. 2.
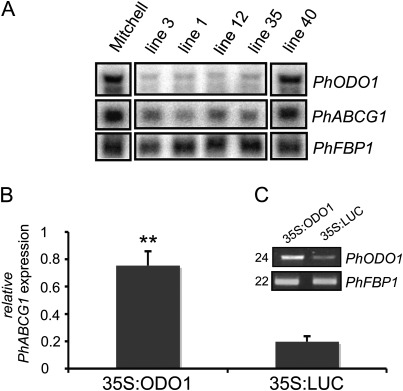
Expression of ODO1 influences PhABCG1 transcript levels. (A) RNA gel blot analysis of ODO1-RNAi lines showing reduced levels of PhABCG1 expression. FBP1 was used to show loading of the gel. Line 40 is a transgenic line in which ODO1 is not silenced (Verdonk et al., 2005). (B) Quantitative RT-PCR showing PhABCG1 transcript levels in petals of Mitchell after agro-infiltration with 35S:ODO1 or 35S:LUC at a time point when endogenous transcript levels are low. The mean and SD of three independent biological replicates are shown. Asterisks indicate significant differences (t-test, P < 0.001, n=3). Actin was used as a reference gene and values are relative to Actin. (C) RT-PCR showing transcript levels of ODO1 in the samples in B. The number of cycles used is shown at the left and the floral binding protein 1 (PhFBP1) of petunia was used as a reference gene. A representative gel is shown.

