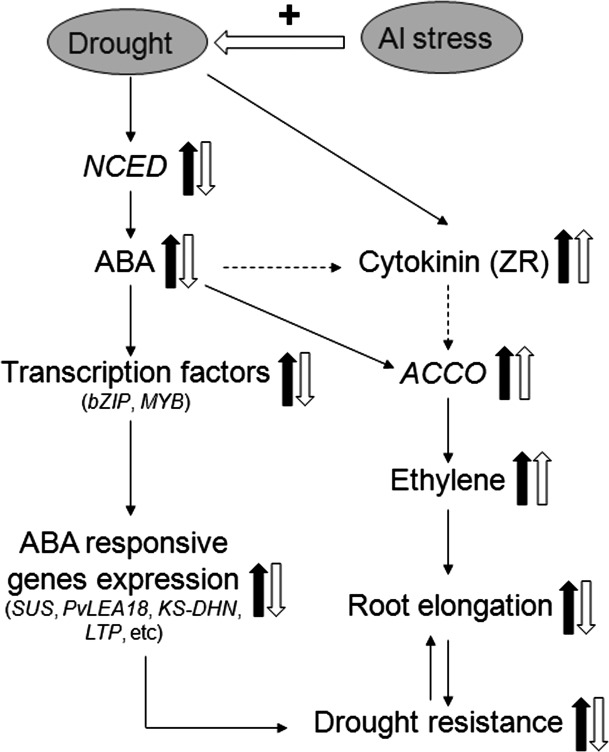
Fig. 12.
Schematic representation of the potential regulatory mechanisms involved in acclimation to drought of root apices of common bean and how Al stress interferes with this acclimation. The thick arrows indicate the up- and down-regulated changes. The thick filled arrows show the effect of the sole drought treatment, and the thick open arrows show the relative changes under combined drought and Al stress compared with the sole drought treatment. The thin dashed arrows indicate the potential connections. For further explanations, see the related discussion.

