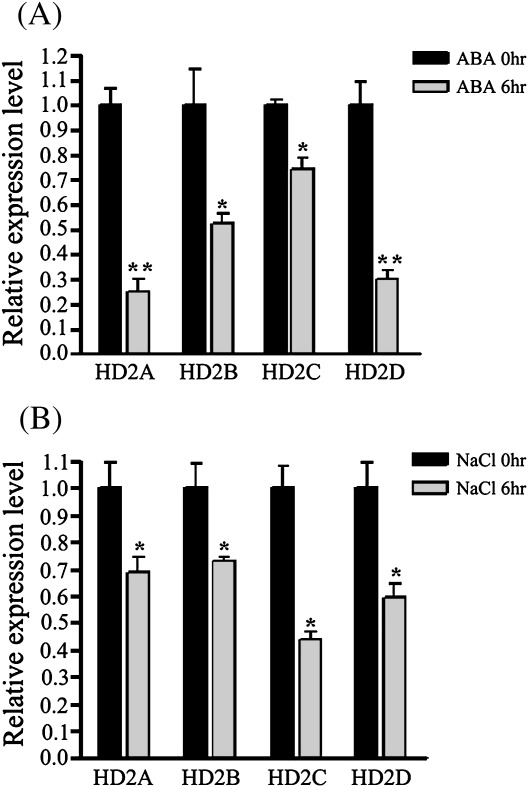
Fig. 1.
Expression of HD2A, HD2B, HD2C, and HD2D in response to ABA and NaCl. 2-week-old plants were treated with 100 μM of ABA (A) or 250 mM NaCl (B). Relative mRNA levels were determined by quantitative RT-PCR analysis. Two biological replicates were carried out and gave similar results. Asterisks mark values that are significantly different from the wild type (t test, *P <0.05, **P <0.01).

