
Figure 4.
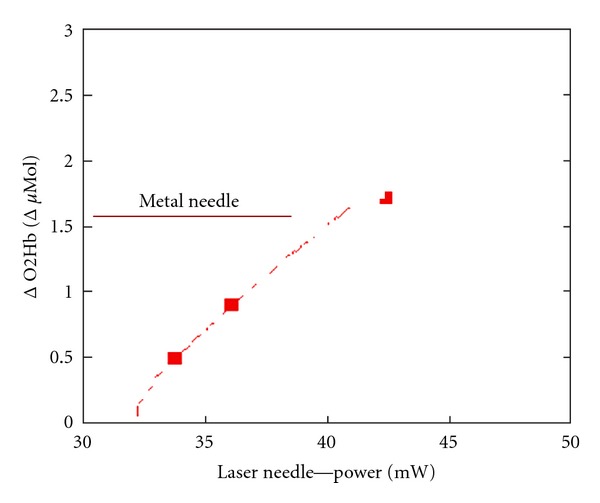
Changes in cerebral oxyhemoglobin concentration using a visual acupuncture scheme with metal needles and laser needles of different optical power. The curve shows the best analytical adaptation to the measurement values of laser needle stimulation (modified from [10]).