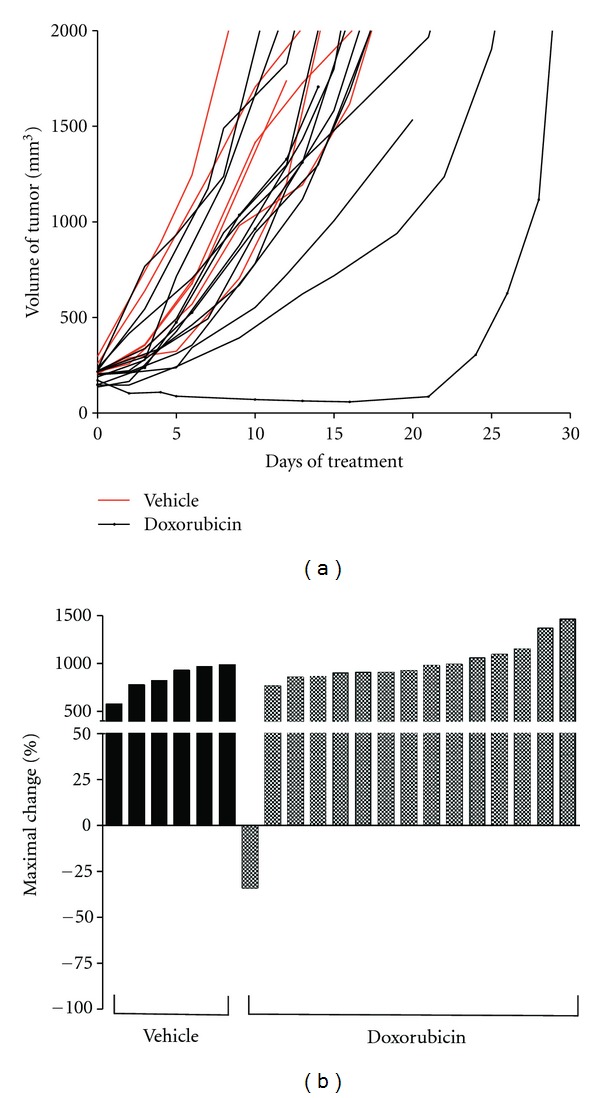
Figure 2.

(a) Tumor volume of mice treated with vehicle alone (red) or doxorubicin alone (black). (b) Waterfall plot of tumor volume response for vehicle (black bars) and doxorubicin (shaded bars). Data is presented as percent maximal loss in tumor volume for animals responding to treatment and as percent maximal gain in tumor volume for nonresponders.
